React Developer Tools
React Developer Tools is a powerful browser extension that helps you inspect React components, edit props and state, and identify performance issues. This guide provides practical, step-by-step examples to debug common React challenges, making it easier to build robust applications.
You will learn
- How to install React Developer Tools
- How to debug component issues step-by-step
- How to identify and fix performance bottlenecks
- How to debug state updates and effects
- How to track down error sources effectively
Browser Extension
The easiest way to debug React websites is to install the React Developer Tools browser extension, available for:
When you visit a React-built website, you’ll see the Components and Profiler tabs in your browser’s developer tools.
Safari and Other Browsers
For browsers like Safari, install the react-devtools npm package:
# Yarn
yarn global add react-devtools

# npm
npm install -g react-devtools
Open the developer tools from the terminal:
react-devtoolsAdd this <script> tag to your website’s <head>:
<html>
  <head>
    <script src="http://localhost:8097"></script>
Reload your website to view it in the developer tools.
Mobile (React Native)
For React Native apps, use React Native DevTools, which integrates React Developer Tools for native element highlighting and debugging. Features mirror the browser extension.
Learn more about debugging in React Native.
For React Native versions before 0.76, follow the Safari and other browsers guide.
Common Debugging Scenarios
React Developer Tools is most effective when used systematically. Below are practical examples to debug common issues, with step-by-step instructions and code snippets.
Debugging Unexpected Re-Renders
Scenario: Your app feels sluggish due to components re-rendering unnecessarily, impacting performance.
Steps to Debug:
- Open React Developer Tools and select the Profiler tab.
- Click the record button (🔴) to start profiling.
- Interact with your app (e.g., click buttons, type in inputs) to trigger re-renders.
- Stop recording and review the flame graph, where wider bars indicate longer render times and multiple bars show frequent re-renders.
- Click a component to see the “Why did this render?” section, identifying causes like prop or state changes.
- Check if parent components are causing unnecessary child re-renders.
Common Causes:
- New object/array references created on every render.
- Missing memoization for props or functions.
- Unnecessary state updates.
Solution: Consider this example where a child component re-renders unnecessarily:
function Parent() {
  const [count, setCount] = useState(0);
  const data = { value: 'test' }; // New object every render
  return (
    <div>
      <button onClick={() => setCount(count + 1)}>Increment</button>
      <Child data={data} />
    </div>
  );
}

function Child({ data }) {
  return <div>{data.value}</div>;
}
Clicking “Increment” causes Parent to re-render, creating a new data object, which triggers Child to re-render.
Fix:
Use useMemo to stabilize the data reference:
function Parent() {
  const [count, setCount] = useState(0);
  const data = useMemo(() => ({ value: 'test' }), []); // Stable reference
  return (
    <div>
      <button onClick={() => setCount(count + 1)}>Increment</button>
      <Child data={data} />
    </div>
  );
}
Now, Child only re-renders if data changes. Use the Profiler to confirm reduced render counts.
Debugging State Updates That Don’t Work
Scenario: Clicking a button doesn’t update the UI as expected, despite state changes.
Steps to Debug:
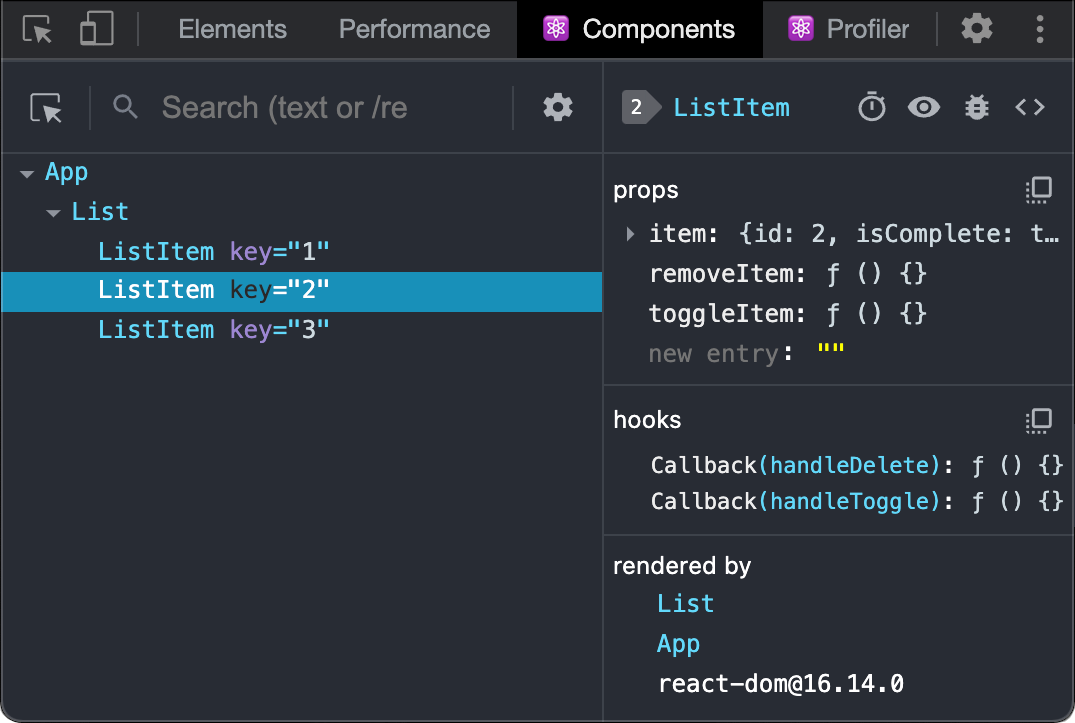
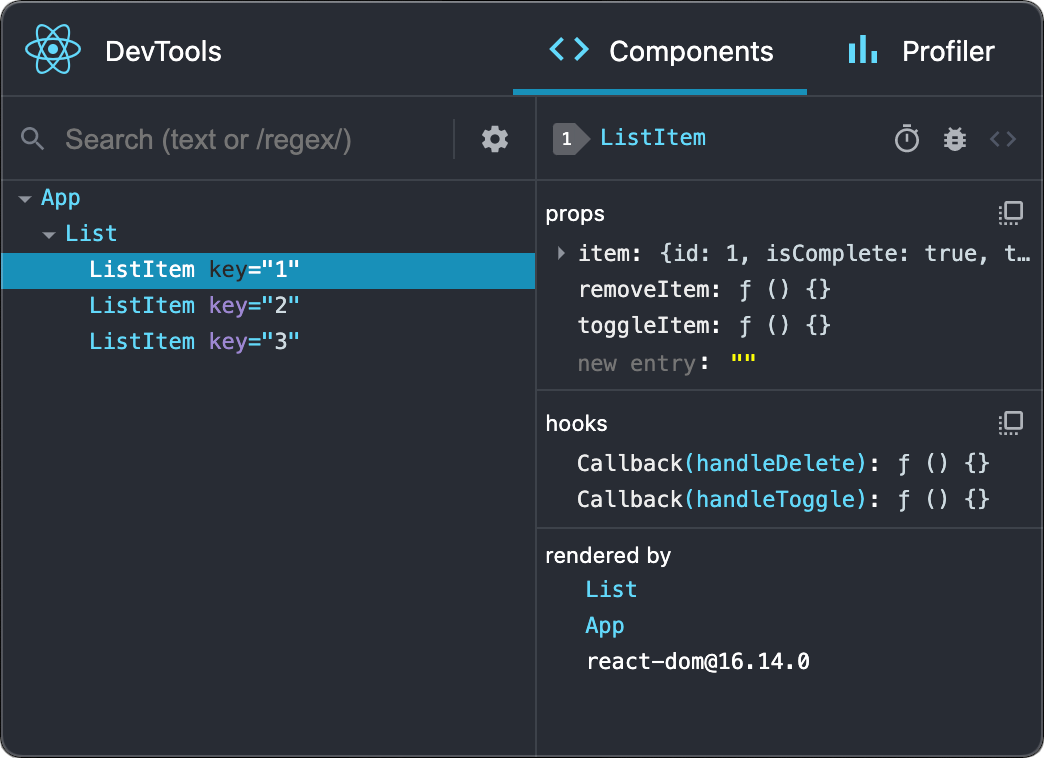
- Open the Components tab in React Developer Tools.
- Select the component in the tree and inspect its state values.
- Trigger the action (e.g., button click) and watch if state updates in real-time.
- If state doesn’t change, check the event handler logic.
- If state changes but the UI doesn’t update, verify JSX rendering logic.
Common Causes:
- Mutating state directly instead of using setState.
- Incorrect state dependencies or conditional rendering.
Solution: Consider this faulty component:
function Counter() {
  const [count, setCount] = useState(0);
  const increment = () => {
    count += 1; // Incorrect: mutates state directly
  };
  return (
    <div>
      <p>Count: {count}</p>
      <button onClick={increment}>Increment</button>
    </div>
  );
}
The UI doesn’t update because count is mutated directly.
Fix:
Use setCount:
const increment = () => {
  setCount(prevCount => prevCount + 1); // Correct: triggers re-render
};
Use DevTools to confirm count updates in the Components tab.
Debugging useEffect Issues
Scenario: An effect runs too often or not at all, causing performance issues or missing updates.
Steps to Debug:
- Add a
console.loginside youruseEffectto track when it runs:
useEffect(() => {
  console.log('Effect ran with:', { dep1, dep2 });
}, [dep1, dep2]);- Open the Components tab and select the component.
- Inspect the hooks section to view dependency values.
- Check if dependencies are stable or changing unnecessarily.
Common Causes:
- Missing dependencies in the array, causing stale data.
- Unstable references (e.g., objects created on every render).
Solution: Consider this problematic effect:
function UserProfile({ userId }) {
  const [user, setUser] = useState(null);
  useEffect(() => {
    fetchUser(userId).then(setUser);
  }, []); // Missing userId dependency
}
The effect doesn’t run when userId changes, leading to outdated data.
Fix: Add userId to the dependency array:
useEffect(() => {
  fetchUser(userId).then(setUser);
}, [userId]);
Use DevTools to verify the effect runs only when userId changes.
Debugging Component Errors
Scenario: A component throws an error, causing the app to crash or display incorrect data.
Steps to Debug:
- Wrap components with an Error Boundary to catch errors:
class ErrorBoundary extends Component {
  state = { hasError: false, error: null };
  static getDerivedStateFromError(error) {
    return { hasError: true, error };
  }
  componentDidCatch(error, errorInfo) {
    console.log('Error:', error, errorInfo);
  }
  render() {
    if (this.state.hasError) {
      return <h1>Error: {this.state.error?.message}</h1>;
    }
    return this.props.children;
  }
}- Open the Components tab and select the failing component.
- Check props and state for null/undefined values or incorrect types.
- Use the browser console’s stack trace to trace the error source.
Example: This component crashes if user is null:
function UserProfile({ user }) {
  return <div>{user.name}</div>;
}
Fix: Add a null check:
function UserProfile({ user }) {
  if (!user) return <div>Loading...</div>;
  return <div>{user.name}</div>;
}
DevTools highlights the error in the component tree, helping you pinpoint the issue.
Performance Debugging
The Profiler tab is key for identifying performance bottlenecks.
Reading the Flame Graph
- Height: Indicates component nesting depth.
- Width: Shows render time (wider = slower).
- Color Intensity: Darker colors mean slower renders.
- Gray Components: Didn’t re-render (optimal).
Common Performance Issues
Scenario: Scrolling a large list is slow.
Steps to Debug:
- Start profiling in the Profiler tab.
- Scroll through the list to reproduce the issue.
- Stop profiling and analyze the flame graph for slow components.
- Check for large lists or expensive calculations.
Example: This renders all items, causing lag:
function ProductList({ products }) {
  return (
    <div>
      {products.map(product => <ProductCard key={product.id} product={product} />)}
    </div>
  );
}
Solution: Use react-window for virtualization:
import { FixedSizeList as List } from 'react-window';

function ProductList({ products }) {
  return (
    <List height={600} itemCount={products.length} itemSize={120}>
      {({ index, style }) => (
        <div style={style}>
          <ProductCard product={products[index]} />
        </div>
      )}
    </List>
  );
}
Install react-window:
npm install react-windowThe Profiler confirms reduced render times for visible items only.
Advanced Debugging Techniques
- Console API: Select a component in DevTools, then type
$rin the console to inspect props ($r.props) or state ($r.statefor class components). - Select in Editor: Right-click a component in DevTools to jump to its source code in your IDE (if supported).
- Time Travel: Use DevTools to revert state changes and see how the UI responds, useful for debugging state transitions.
Troubleshooting DevTools Issues
- DevTools Not Appearing: Ensure React 16.0+ is used, check for multiple React versions (
npm ls react), and verify development mode. - Poor Performance: Disable profiling when not needed, collapse large component trees, or filter components using the search box.
- Missing Component Names: Use named components or set displayName:
const HelloComponent = () => <div>Hello</div>;
HelloComponent.displayName = 'HelloComponent';
export default HelloComponent;
This enhanced documentation equips you with practical tools to debug and optimize React applications effectively.